Veteran Florida Guides Concerned About False Albacore
While the ASGA team is extremely proud of the community we’re building with the Guide
*Last Updated January 5th, 2023*
Albie genetic data have been collected and analyzed for Year 1 of The Albie Project. Samples were collected from New York, Massachusetts and North Carolina this past fall. Initial results indicate that we are likely looking at one coastwide stock. To gain more clarity, we are initiating a broader DNA study in Year 2 of The Albie Project in 2023.
A note from Steven Bogdanowicz:
“Briefly, I constructed a DNA library enriched for microsatellite loci from a single fish we caught with Vinny in Montauk last October. PCR primers to 4-base repeats were designed and ordered, and DNAs from fin clips were extracted with a simple Sodium Hydroxide/Tris protocol. Primer pairs were pooled in groups of 23 loci, DNA samples were amplified, barcoded, and sequenced, and the resulting diploid genotypes were called with a python script. Final data matrix has 77 individuals and 68 unique microsatellites.
Two different softwares (Structure and adegenet) were used to analyze the data. Important to remember here that we didn’t set out to determine whether fish from NY/MA/NC were different from each other; rather we’re asking “If we take a sample of albies from a pretty broad area at about the same time, how many genetic groups do we see?” Both softwares agree that the answer to that is “one.” The attached Probability by K graph (Figure 1 – screenshot below) is from Structure, and shows most likely number of groups (k) is 1. The attached Rplot_BIC pdf is from adegenet, and shows the same (lowest BIC value represents the most likely number of groups).”


While the ASGA team is extremely proud of the community we’re building with the Guide

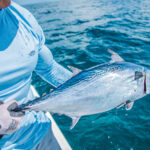
Feature Image: A false albacore being landed off Jupiter Florida by the Cheeky Fishing team,

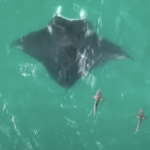
Feature Photo: “Best Practices for Fishing Cobia Around Manta Rays” The Florida Manta Project is

We caught this article a few days ago. Here’s the summary: Maryland striped bass commercial
We rely on our members and donations to keep fighting for a sustainable tomorrow in marine conservation.
By using this website, you agree to our use of cookies. We use cookies to provide you with a great experience and to help our website run effectively. To learn more, please review our privacy policy.
3 Responses
Please can you provide more info on the data? I’ve done tons of microsat work (I’m a popgen prof) but old school fragment analysis where each locus was genotyped separately and there were many alleles per locus. Is that what you get from Illumina data? Your comment about primers annealing to the repeats is confusing. But what I’d love to see is the basic data of # alleles per locus, He on average across loci, F averaged across loci, and what the structure plot looks like with K=2 . . ..
This is very exciting!!!!!!!!!!!!!!!!!!
Hey John,
Thanks for the message. You lost me when you started talking about the Illuminati. lol
We’d be happy to share the pdf report. Please send your best email to info@saltwaterguidesassociation.org